Governance Analysis · MDB Reform Advisory · July 2026
The Missing Mirror: Twenty-Five Years of World Bank Service Delivery Guidance — and the IEG Evidence It Does Not Cite
The World Bank’s June 2026 synthesis paper on service delivery in fragile settings is the most operationally sophisticated guidance the Bank has produced on this subject. It is also the latest step in a twenty-five year trajectory of increasingly sophisticated analytical frameworks — each of which has diagnosed why borrowing governments struggle to deliver services, and none of which has asked the same question of the Bank itself. The IEG’s own evaluation database, covering 10,453 projects including 420 service delivery projects in FCS-classified countries, identifies a different and more fundamental constraint than the PCV paper addresses: not the quality of implementation, but the quality of project design at entry. In those FCS service delivery projects, 23.1% achieved a Satisfactory outcome. Three in four dollars did not. The Missing Mirror is the absence of the inward diagnosis that would explain why.
I. The Report and Its Place in a Twenty-Five Year Trajectory
In June 2026, the World Bank released three new documents on service delivery in fragile and conflict-affected settings: a 190-page synthesis paper (P505313), an 82-page evidence review covering 200+ peer-reviewed papers, and an 18-page practitioner operational note. The research programme behind them was substantial — 37 structured interviews, a 42-respondent survey, a Washington workshop with over 100 participants, and country-level analytics across 26 countries experiencing protracted crisis and violence. Phase 2 is planned.
P505313 is not an isolated publication. It is the latest in a twenty-five year sequence of increasingly sophisticated analytical frameworks on service delivery, governance, political economy, adaptive management, and fragility. The table below maps that trajectory against a single outcome figure.
Named the approval culture and weak project design as core institutional pathologies. Recommended structural reform of preparation incentives.
Governance, accountability, and citizen voice as the primary levers for improving service delivery.
Political economy, state capability, and implementation capacity added to the analytical toolkit. Projects grew more complex.
Recognised that fragility and conflict required a different development model. Laid groundwork for the FCV Strategy.
Iteration, learning, and adaptation positioned as the operational response to implementation complexity.
Protracted crisis, displacement, and conflict-sensitive programming given a dedicated strategic framework. IDA FCV envelope scaled to 0bn.
Most sophisticated operational guidance the Bank has produced on service delivery in fragile settings. Funded by FCDO. No mandatory evaluation of its use or impact.
FCS service delivery (health, education, urban, water, governance): 23.1% S+ across 420 evaluated projects, 1.8bn committed, 2000–2026. The analytical frameworks have become more sophisticated. The outcomes have not.
II. The IEG Evidence: What the Bank’s Own Data Show
This analysis draws from the IEG’s ICRR database (March 2026 update, 10,453 evaluated projects). The performance threshold used throughout is S+ (Satisfactory or Highly Satisfactory) — the minimum standard IFC and MIGA apply to their own corporate performance. The IDA21 Deputies Report states that IEG ratings show 91% satisfactory performance in IDA-financed operations — using the MS+ threshold. The analysis below uses S+. The gap between the two figures — 68 percentage points for IDA+FCS service delivery sectors — is itself a finding.
Finding 1: Service Delivery in FCS Countries Performs at 23.1% S+ — Flat Across Two Decades
- Health: 27.4% — 84 projects
- Education: 24.7% — 81 projects
- Urban / Resilience: 25.0% — 116 projects
- Water: 18.0% — 50 projects
- Governance: 18.0% — 89 projects
- All 5 sectors combined: 23.1% S+
- 2010–2019: peak analytical activity
- 496 projects evaluated, 0.8bn committed
- S+ rate: 19.2% — lowest in the database
- More sophisticated guidance.
- Worse measured results.
Finding 2: Quality at Entry Is the Game Changer
The relationship between Quality at Entry ratings and development outcomes in FCS countries is one of the strongest and most consistent patterns in the IEG dataset.
| Quality at Entry (IEG) | Projects | S+ Outcome Rate | Committed ($) |
|---|---|---|---|
| Highly Satisfactory (HS) | 16 | 81.2% | .2bn |
| Satisfactory (S) | 315 | 61.0% | 2.6bn |
| Moderately Satisfactory (MS) | 397 | 17.4% | 9.3bn |
| Moderately Unsatisfactory (MU) | 216 | 1.4% | 1.3bn |
| Unsatisfactory (U) | 71 | 0.0% | .7bn |
| Highly Unsatisfactory (HU) | 6 | 0.0% | /bin/sh.1bn |
Finding 3: Poor QAE Is Endemic
Across the five service delivery sectors the PCV paper covers, in FCS countries evaluated since 2000, 33.7% of projects received Moderately Unsatisfactory or worse QAE ratings from IEG. One in three service delivery projects in the most difficult development environments on earth entered implementation already carrying design weaknesses that the QAE gradient shows are strongly associated with below-S+ outcomes. In those 141 poorly-designed FCS service delivery projects, the S+ outcome rate is 0.0%. This is the most actionable variable in the entire dataset — the variable the Bank directly controls. It does not appear in the PCV paper.
Finding 4: M&E Failure Undermines the Adaptive Management Recommendation
Over half of FCS projects — 55.6%, covering 473 of 850 M&E-rated projects — have monitoring and evaluation frameworks rated Negligible or Modest by IEG. The PCV paper recommends embedding ongoing context analysis to support adaptive implementation. That recommendation requires a functioning monitoring system. The majority of FCS projects do not have one.
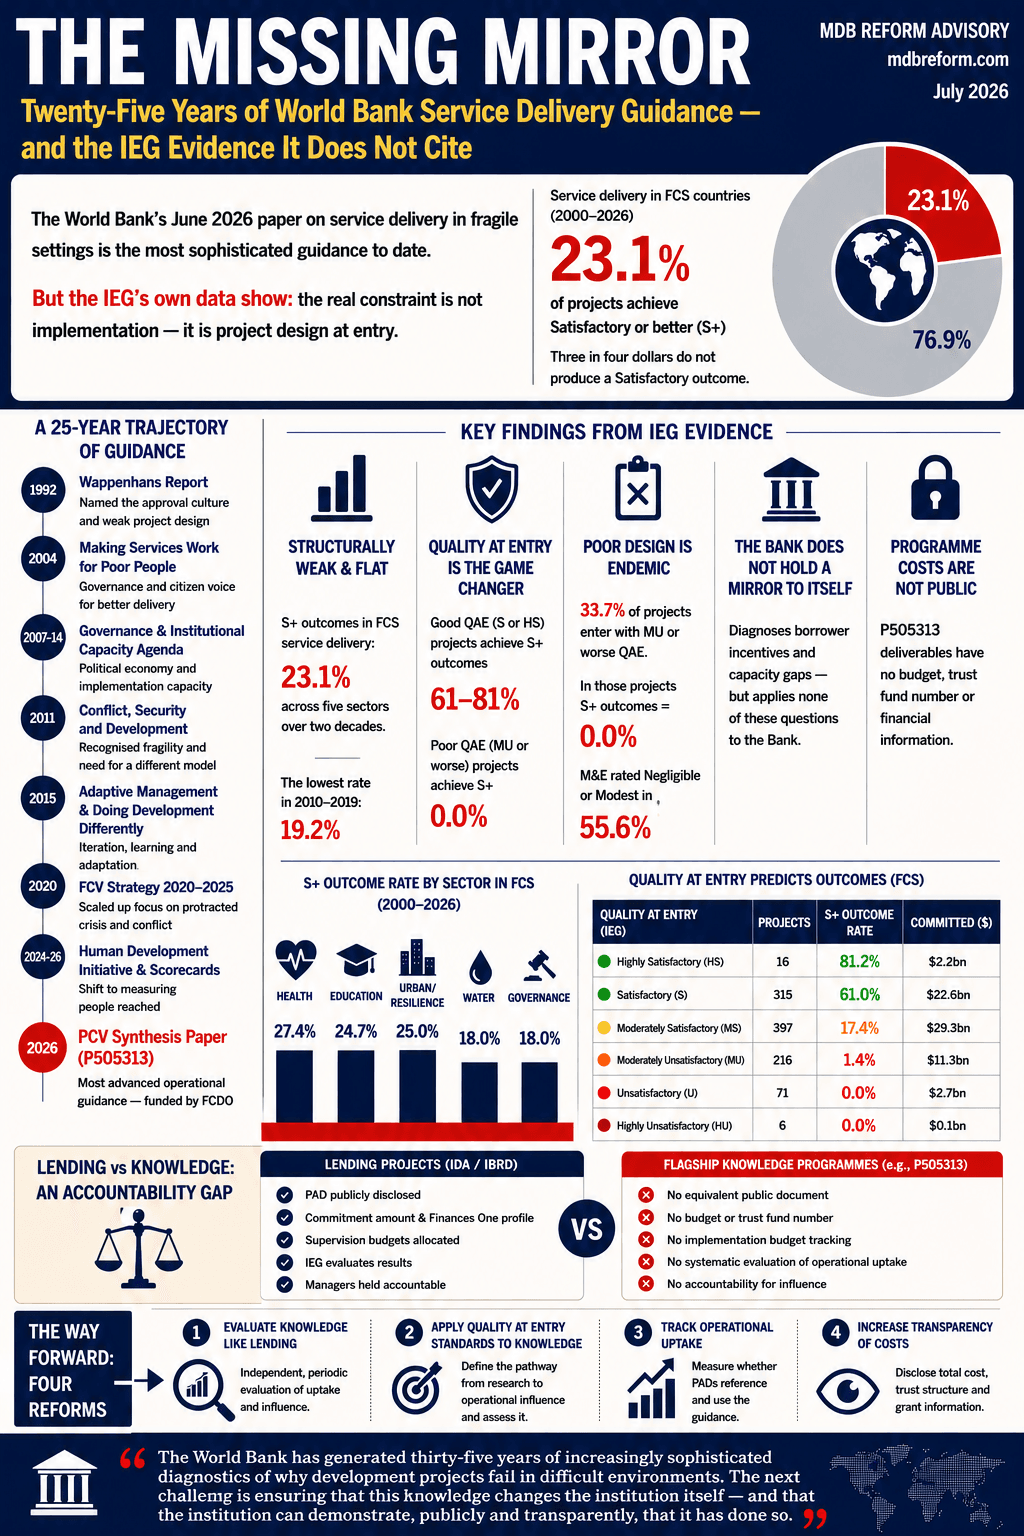
Key findings from the IEG evidence base. Click to enlarge.
III. The Bank Diagnoses Governments. It Does Not Diagnose Itself.
The PCV paper applies the Bank’s institutional diagnostic framework — with considerable sophistication — to borrowing governments. It asks whether those governments have adequate implementation capacity, whether accountability systems function, whether institutional incentives are aligned with service delivery outcomes. These are exactly the right questions. They are also questions the Bank has been asking of client governments since the Wappenhans Report was commissioned in 1992.
What is absent is any equivalent analysis directed at the Bank itself. Each question in the table below corresponds to a variable that IEG data shows has a direct, measurable relationship with project outcomes in FCS settings.
- Is there political commitment to reform?
- Is implementation capacity adequate?
- Are accountability systems functioning?
- Are incentives aligned with development outcomes?
- Is the M&E framework credible?
- Is there risk of elite capture?
- Are accountability mechanisms for programme performance in place?
- Is management rewarding lending volume over design quality?
- Are TTLs given adequate preparation time and resources?
- Who is accountable when a poorly-designed project fails?
- Are Bank incentives aligned with outcomes or disbursement targets?
- Why do weak Results Frameworks continue to be approved by QER?
- Who bears responsibility for over-ambitious PDOs in FCS contexts?
- Why is ASA — 83M/year — not subject to independent outcome evaluation?
IV. Four Reforms
Every flagship ASA programme should be subject to periodic independent review covering operational uptake, influence on project preparation, and evidence of use in PADs and restructuring papers. IFC has systematically evaluated all client-facing advisory projects since 2008, with IEG validating a 51% sample annually. The World Bank has no equivalent for ASA.
Flagship ASA should state, at inception, the pathway from research to operational uptake. At closure, that pathway should be assessed. If the Bank believes project QAE predicts outcomes, it should ask whether knowledge QAE predicts organisational learning.
A simple operational tracking mechanism — identifying whether PADs for projects in PCV countries reference the framework developed in P505313 — would convert a publication metric into a learning metric. Annual reporting to the Board on Quality at Entry trends, disaggregated by FCS status and sector, would make the pattern documented here visible to management and shareholders.
P505313 Phase 1 produced 290 pages across three documents, involved 37 structured interviews, a 42-respondent survey, over 100 workshop participants, and country analytics across 26 PCV settings. None of this cost is publicly accessible. A lending project of equivalent scale would have a publicly disclosed PAD, a commitment amount, and a Finances One profile. The accountability asymmetry is structural.