The Education Record · Spring Meetings 2026 · MDB Reform Platform
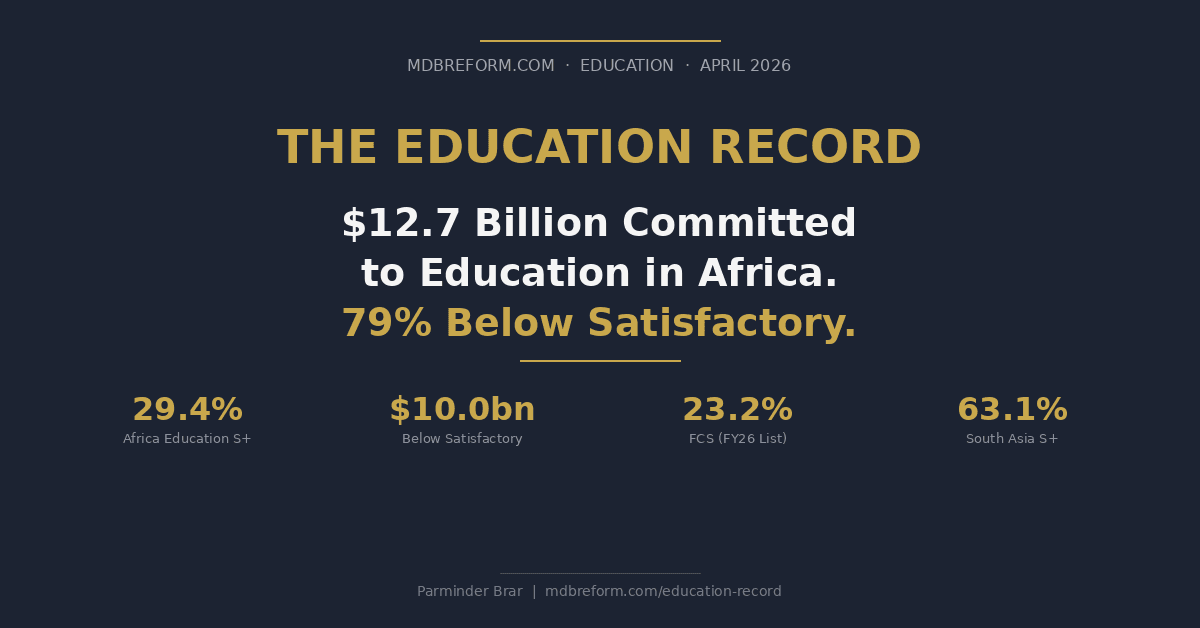
The World Bank can get African children into school. Whether they are learning inside it is the question the evaluation record has stopped answering — and the question the next decade of lending must confront. $12.9 billion committed to education in Sub-Saharan Africa. 70 percent reported successful. 30 percent by the honest benchmark. The 41-point gap between those two numbers is the central accountability failure this paper documents.
The World Bank reports portfolio performance using the MS+ benchmark (Moderately Satisfactory or above), which counts any project that partially achieved its objectives as successful. The more demanding S+ benchmark (Satisfactory or Highly Satisfactory) counts only projects that substantively achieved their objectives. Both measures are published by IEG. The Bank uses MS+ in all its corporate reporting and replenishment documents.
In most sectors the gap between the two measures is 10 to 20 percentage points. In education it is 41 percentage points — the widest of any sector in Africa, exceeded only by Transport (44pp) and MTI (43pp). This means education has the largest concentration of Moderately Satisfactory outcomes: projects that got children into school, trained teachers, built classrooms, launched management systems — but did not produce measurable learning gains. MS+ absorbs that shortfall as “partial achievement.” S+ does not.
IEG’s own 2024 flagship evaluation found that projects with learning indicators receive lower ratings than those without. The evaluation standard is more demanding when you measure what actually matters. The 41-point gap is not a measurement artefact. It is the distance between schooling and learning.
The World Bank’s Education Global Practice committed $12.9 billion across 207 IEG-evaluated projects in Sub-Saharan Africa. The MS+ rate — counting Moderately Satisfactory as success — is 70 percent. The S+ rate, the benchmark the Bank applies to IFC and MIGA and the standard this platform uses throughout, is 30 percent. The 41-point gap is among the widest of any sector in Africa. Ten countries — Ethiopia, DRC, Zambia, Cameroon, Namibia, Congo-Brazzaville, CAR, Burundi, Liberia, Mauritius — combine for 33 projects and $2.5 billion committed with zero Satisfactory outcomes.
This paper goes further than diagnosis. Four independent sources — the HCI+, IEG’s Confronting the Learning Crisis, Rolleston et al., and UNESCO — reach the same conclusion through different methodologies: the Bank’s education portfolio measures inputs and outputs, not learning. And four models — Ethiopia GEQIP, Kenya SWAp, Kenya Tusome, and Liberia LEAP — point to the pathway out: structured pedagogy, teacher coaching, accountability for results, and continuous measurement of learning. The binding constraint may now be located inside classrooms rather than inside education ministries.
Complete project-level tables. Country breakdown. The MS+/S+ gap with IFC/MIGA cross-reference. Spring Meetings sector data. Five operational recommendations.
10-country Zero Club profiles. Ethiopia/GEQIP anchor case. Five failure modes from 207 IEG lesson texts. Four-model synthesis. Kenya’s three-generation evolution. Liberia LEAP experiment. Rwanda counter-case.
Finding 1: The 41-Point Accountability Gap
The gap between what the Bank reports and what the honest benchmark shows is not a rounding difference. It is a structural feature of how the education portfolio is evaluated — and how it reports success to donors and Deputies.
30%
Satisfactory or better
Satisfactory
41pp gap
30%
Below any pass
The 41pp gap — the amber band in the chart above — is the share of the portfolio counted as “successful” by MS+ but not by S+. These are the Moderately Satisfactory projects: ones that built classrooms, raised enrolment, trained teachers, launched education management systems, and partially achieved their objectives. What they did not achieve, consistently, is measurable learning gains.
How this compares across sectors
| Sector | S+ rate | MS+ rate | Gap (pp) | Assessment |
|---|---|---|---|---|
| Transport | ~21% | 65% | 44pp | Worst gap in Africa |
| Education | 30% | 70% | 41pp | This paper |
| MTI (DPF-heavy) | ~28% | 70% | 43pp | Instrument driven |
| Energy | 36% | ~55% | ~19pp | Scale drives failure |
| Health | 29% | ~55% | ~26pp | Access/quality split |
Finding 2: Ethiopia — 33 Years, $1.3 Billion, Never Once Satisfactory
Ethiopia is not a fragile state. It is one of Africa’s fastest-growing economies, a non-fragile lower-middle-income country with a functioning Ministry of Education, and the Bank’s largest education borrower in Africa. Eight IEG-evaluated projects. $1.3 billion. 33 years. Not one rated Satisfactory.
| P-Code | Project | Year | Rating | Committed |
|---|---|---|---|---|
| P000721 | Education VII | FY1988 | U | $70M |
| P000732 | Education Sector Development | FY1998 | MS | $234M |
| P069083 | Ethiopia Distance Learning LIL | FY2001 | MU | $3M |
| P078692 | Post Secondary Education | FY2005 | MU | $40M |
| P106855 | General Education Quality Improvement (GEQIP 1) | FY2009 | MS | $413M |
| P129828 | General Education Quality Improvement (GEQIP 2) | FY2014 | MS | $530M |
| P163608 | Education Results Based Financing | FY2017 | MS | $30M |
| P174206 | COVID-19 Education Response | FY2021 | MS | $15M |
| Total: 8 projects, 33 years | 0% S+ | $1.3bn | ||
The GEQIP paradox is the central finding from Ethiopia: strong systems proved necessary but not sufficient. The Bank built the institutional architecture for a functioning education system. That architecture did not automatically translate into what children learn inside classrooms. And because GEQIP measured inputs and outputs rather than learning, the gap between what the system delivered and what children achieved was not consistently visible in the project’s own monitoring framework — until independent evaluators looked.
Finding 3: The Zero Club — Ten Countries, Zero Satisfactory
Ten countries in Sub-Saharan Africa have two or more evaluated education projects and zero Satisfactory outcomes across all of them. Combined: 33 projects, $2.5 billion committed, 19 percent of all Africa Education commitment. Not all are fragile states. The Zero Club pattern is not explained by fragility alone.
| Country | Projects | Committed | Context |
|---|---|---|---|
| Ethiopia | 8 | $1.33bn | Non-fragile. Africa’s largest education borrower. GEQIP paradox. |
| DRC | 5 | $389M | Fragile. Appears in five Zero Clubs simultaneously (Health, MTI, Transport, Energy, Education). |
| Zambia | 4 | $235M | Non-fragile. Lower-middle income. Access-quality trade-off unresolved. |
| Cameroon | 3 | $161M | Non-fragile. Also in the Health Zero Club. |
| Namibia | 3 | $129M | Upper-middle income. Stable. Teacher quality the binding constraint. |
| Congo-Brazzaville | 3 | $111M | Lower-middle income. Oil-revenue dependence distorts education investment. |
| CAR | 2 | $47M | Fragile. External implementation the only viable model. |
| Burundi | 2 | $54M | Fragile. M&E absence the primary evaluator finding. |
| Liberia | 2 | $36M | Post-conflict. LEAP experiment site. Access gains; learning accountability gap. |
| Mauritius | 1 | $14M | Upper-middle income. Small island. System reform without measurement. |
| Total | 33 | $2.5bn | Zero Satisfactory. Every dollar will be repaid. |
Finding 4: Four Independent Sources Confirm the Diagnosis
The Zero Club findings are based on IEG project ratings. Four entirely independent sources — drawing on different methodologies, different datasets, and different analytical frameworks — reach identical conclusions. The convergence is the proof.
Finding 5: Five Failure Modes
IEG lesson text across all 207 education projects was manually coded. M&E weakness is the most frequently cited theme — appearing 195 times, the highest frequency of any theme in any sector in the Zero Club series. Five structural failure modes emerge from the IEG’s own evaluation language, not from external critique.
| Failure Mode | Countries | IEG language (direct citation) |
|---|---|---|
| Design complexity exceeding institutional capacity | Ethiopia, Kenya, DRC | “Civil works are by themselves insufficient to improve the quality of instruction.” (Ethiopia, FY1988, U) |
| Access-quality trade-off unresolved | Zambia, Ethiopia | “Government campaigns to increase access should be accompanied by a commitment to improve learning outcomes.” (Zambia, FY1999, MU) |
| M&E without learning measurement | Burundi, Chad | “Realistic project ratings might have alerted management earlier.” (Chad, FY2003, U) |
| Teacher training without quality assessment | Ethiopia, Cameroon | Only 22 of 188 operations tracked the impact of teacher training on classroom practice. (IEG, 2024) |
| Institutional absence in fragile states | DRC, CAR, Liberia | “Performance-based financing can be an effective instrument in fragile settings” — but even viable PBF produced MS, not S. (DRC, FY2017, MS) |
The common thread across all five: the form of education expands — classrooms, teachers, textbooks, management systems — without the function following. The Bank measures what it builds. It does not consistently measure what children learn from it.
Finding 6: What Works — Four Models
The four-model comparison is the most important analytical contribution of the education paper. Each model has been tried in Africa. Each teaches a distinct lesson. Together they converge on the same finding.
| Model | Example | Result | The lesson |
|---|---|---|---|
| Access expansion + strong systems | Ethiopia GEQIP ($943M, MS) | Access rose sharply. Learning: mixed to flat. Strong systems necessary but not sufficient. | Systems are a precondition, not a solution. |
| Sector-wide governance reform | Kenya SWAp ($468M, U) | Failed. Sector-wide financing without explicit accountability did not deliver learning. | Scale without accountability fails. |
| Structured pedagogy + teacher coaching | Kenya Tusome (government programme) | Strong literacy gains. Changing what teachers did inside classrooms produced learning. | The classroom is where learning happens or doesn’t. |
| External accountability + results | Liberia LEAP (RCT, 93 schools) | 0.18 SD gains. But cost $640/student vs government’s $50. Trade-offs limit scalability. | Accountability works; privatisation has limits. |
The Kenya evolution
Kenya’s education portfolio — eight IEG-evaluated projects across three decades — traces the Bank’s learning curve. Generation 1 (1990s–2000s): inputs and institutions. Universities (U), Early Childhood Development (U). Generation 2 (mid-2000s): governance and accountability. Free Primary Education ($50M, S) worked with controls; the $468M SWAp (U) failed without them. Generation 3 (2015 onward): learning-focused reform. PRIEDE ($88M, MS), KSEIP ($200M, MS), and the COVID response (S) increasingly focus on structured pedagogy, teacher coaching, learning assessment, and results-based financing. Kenya’s Tusome programme achieved some of the strongest literacy gains in Africa within government systems — at government cost, without the trade-offs of external management.
The Liberia LEAP lesson
Liberia’s LEAP programme contracted eight private operators — including Bridge International Academies, Rising Academies, and BRAC — to manage 93 public primary schools. A randomised controlled trial found learning gains of 0.18 standard deviations. But the costs were prohibitive: $640 per student against the government’s $50. Bridge expelled teachers and displaced students. The IFC had invested $13.5 million in Bridge; its Compliance Advisor Ombudsman found “substantial concerns,” and IFC divested in 2022. LEAP demonstrates that accountability produces learning. It does not demonstrate that privatisation is the mechanism. Kenya’s Tusome achieved comparable gains within government systems, at government cost.
Finding 7: Where Education Succeeds — and Why
The Zero Club argument is strengthened by identifying where the Bank’s education portfolio succeeds. Rwanda demonstrates that Zero Club status is not permanent. Countries can exit when implementation discipline changes.
| Country | S+ Rate | Committed | What made the difference |
|---|---|---|---|
| Rwanda | 75.4% | $245M | Imihigo performance contracts at school level; community accountability for learning outcomes; government ownership of results measurement. |
| Mauritania | 66.2% | $179M | Focused literacy targets with explicit learning outcome indicators built into project design from the outset. |
| Cabo Verde | 63.6% | $28M | Small scale; single implementing ministry; genuine government ownership of the learning objective rather than the enrolment target. |
| Sudan | 56.3% | $175M | Emergency operations with bounded objectives and external implementation support — similar to the Somalia model in other sectors. |
What the successes share
Learning outcome indicators explicit from project design. Accountability connecting teachers to results. Scale matched to implementation capacity. Government ownership of the learning objective. Continuous measurement built in.
What the Zero Club countries share
Inputs and outputs measured; learning not consistently tracked. System reform without classroom-level accountability. Design complexity exceeding institutional capacity. Teacher training without quality assessment of classroom practice.
The Binding Constraint
The IDA21 Human Capital agenda commits the World Bank to a generation-defining expansion of education investment across Africa. The evaluation record documented in this paper is the foundation that agenda rests on. The 30 percent S+ rate, the 41-point gap, and the ten-country Zero Club are not historical footnotes — they are the current state of the portfolio. The pipeline that will deploy IDA21 education resources is built by the same institutional architecture that produced these outcomes.
The diagnosis is now clear enough to act on. Four independent evidence streams confirm it. The pathway out is documented in four models. The binding constraint has migrated: it is no longer primarily inside education ministries but inside classrooms — in what teachers do, how their practice is supported, how learning is measured, and whether the system holds anyone accountable for whether children can read. The Bank can get African children into school. Whether they are learning inside it is the question the next decade must answer.
$12.9 billion committed to education in Sub-Saharan Africa. 30 percent Satisfactory by the honest benchmark. 70 percent by the reported one. The 41-point gap is not a statistical artefact. It is the distance between schooling and learning — and the space in which the Bank’s corporate reporting has operated for two decades without being required to close it. Four in five African 10-year-olds cannot read a simple story. The HCI+, IEG’s own 2024 flagship, Rolleston et al., and UNESCO all say the same thing through different lenses: inputs are being delivered; learning is not.
The Zero Club Education paper documents 10 countries, 33 projects, $2.5 billion, zero Satisfactory. DRC is in five Zero Clubs simultaneously. The pattern is institutional, not sectoral. Every dollar committed to education in these ten countries will be repaid — the sovereign guarantee ensures that. Whether the children in those countries learned to read is a question the credit rating does not ask.
10-country Zero Club profiles. Ethiopia/GEQIP anchor case. Five failure modes from manual coding of 207 IEG lesson texts. Four-model synthesis. Kenya’s three-generation evolution. Liberia LEAP experiment in full. Rwanda counter-case. DRC cross-sector pattern. Missing counterfactual analysis.